How Much Money Can My Franchise Make?

One of the most common questions prospective franchisees have when looking at a franchise opportunity is: "How much money can I make if I open this franchise business?"
It's the critical question considering the
investment of time and money required to buy and run a franchise.
But working out the numbers can be challenging if you don't have the proper guidance. Getting to the bottom line requires a basic understanding of franchise accounting, a willingness to do a bit of digging through FDDs / UFOCs (more on these below), and the ability to perform some simple arithmetic to build a basic set of financial projections (your mini business plan in numerical form).
Not to worry! We're here to walk you through it all, step-by-step.
Grab a
cup of coffee and read on for FranchiseHelp's master guide to estimating the
profit potential of any franchise opportunity.
Basic Franchise Business Accounting

Before we can calculate profit potential, we'll need to understand the figures we're hoping to estimate:
- Sales (or Revenue)
- Cash Flow
- Profit (or Net Income) and Loss
Sales (also called "revenue") are the monies that a business receives in exchange for goods sold or services rendered over a given period of time. For example, when you buy a footlong from Subway or a chicken sandwich from Chick-fil-A, you receive the goods (your food) immediately and your payment (say, $5 for your sub) is booked by the store as sales.
To extend the example, if 1,000 people were to come into the store that day and pay $5 each for their meal, the store would book $5,000 in sales (revenue) for the day.
That definition of sales is straightforward and sufficient for purposes of our discussion. In reality, there are some accounting considerations that determine how and when sales are actually recorded (or "recognized," to use accounting speak). But those details won't be important for our initial evaluation of a franchise's profit potential.
(If you really want to get into
those gory details, we've assembled a separate overview of advanced
franchise accounting terms.)
Cash flow is simply the difference between money a business brings in and money that a business sends out in a given period of time. Many investors believe that analyzing cash flow is the purest financial analysis you can perform, because regardless of industry, business model, and fancy accounting practices, there's always a certain amount of cash in a company's bank account at the start of a period (say, the start of a month or year) and a certain amount of cash at the end of that period. Cash flow is the measure of that change. (For a more in-depth look at cash flow, you can review our guide to advanced franchise accounting terms.)
Profit (also known as "net income") or loss is defined as sales minus costs and expenses. We already discussed Sales (revenue) above, but what are costs and expenses? At the most basic level, costs and expenses include any resources (cash as well as manpower or other resources) expended in the running of the business.
Examples include the cost of ground beef and burger buns a burger joint purchases from its suppliers, the cost of produce a restaurant buys at the farmer's market, the wages a grocer pays its bag boys, and the cost of print toner and office supplies a graphic designer buys at Office Depot.
Technically speaking, costs and expenses are not the exact same thing, but in the day to day, non-CPA world these terms are regularly used interchangeably. (And again, for a more nuanced discussion of what constitutes a cost and what constitutes an expense, you can reference FranchiseHelp's overview of advanced franchising accounting.)
Preparing to Build Your Franchise Financial Projections

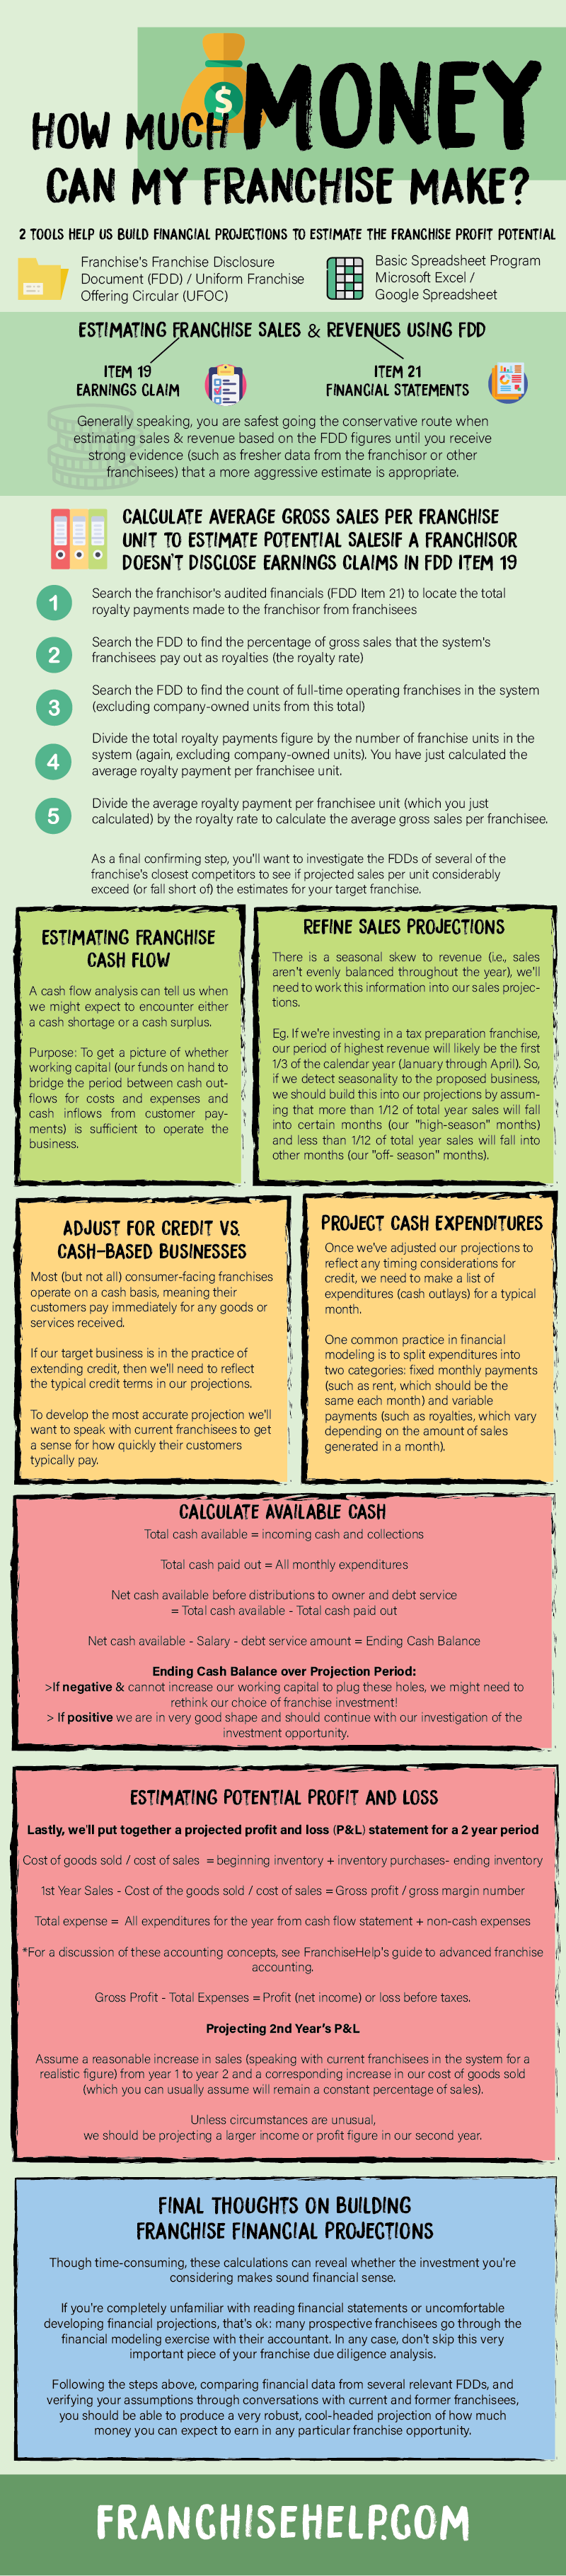
Now that we've familiarized ourselves with some basic accounting terms, we'll need to obtain two tools to help us build out financial projections to estimate the profit potential of our chosen franchise:
- One of the first things we'll want to obtain is a copy of our chosen franchise's franchise disclosure document (FDD). These disclosure documents are the richest source of publicly available information on the financial characteristics and performance of a franchise system. We'll explain how to use the FDD below.
- The second tool we'll need is a basic spreadsheet program. Chances are you already have Microsoft Excel installed on your computer. If you don't own a copy of Excel, you can just use the excellent and free online Google Sheets program.
Estimating Franchise Sales / Revenues
To estimate franchise sales, we'll be picking apart two sections (called "Items") of the disclosure document with particular interest:
- Item 19 (the earnings claim), wherein about 1/3 of franchisors provide an overview of the financial performance of their franchise units; and
- Item 21 (financial statements), wherein franchisors provide a summary of the overall franchise system's financial performance.
Estimating Potential Sales Using Item 19 Earnings Claims of the FDD
Pick up the FDD for the franchise you're analyzing and dive right into the Item 19. Within that section you should locate a table or chart that supplies you with some figures of average sales for franchised units. The information below, for example, were taken from the Item 19 of Burger King's FDD / UFOC.
| Traditional Restaurants | Company | Franchise |
| Low Annual Sales | $309,073 | $203,478 |
| High Annual Sales | $2,368,460 | $2,640,276 |
| Median Sales | $1,109,095 | $1,081,970 |
| Nontraditional Restaurants | Company | Franchise |
| Low Annual Sales | $302,545 | $66,740 |
| High Annual Sales | $2,199,993 | $3,796,189 |
| Median Sales | $547,311 | $716,341 |
Scanning the table above, we find that the system's "traditional" franchise restaurants produced median sales of $1,081,970 for the previous year. For our rough projection of revenue potential, that figure is a very decent estimate.
Why did we choose to focus on the median sales of "traditional" restaurants? Well, according to the FDD, nontraditional sites include:
(1) "expressway" facilities serving a limited menu;
(2) restaurants at institutional locations (such as airports, colleges, hospitals, tourist locations, etc.);
(3) co- branded facilities, and
(4) restaurants at double drive-thru facilities.
If we were looking to open up a location that fits the description of nontraditional sites then the figure we would focus on is the $716,341 of median sales produced by nontraditional restaurants for the previous year.
Why did we choose to focus on the median sales of "franchise" restaurants rather than "company" restaurants? As a franchisee, we will own a franchise restaurant. Company restaurants are units that are owned by the parent company and not by individual franchisees in the system.
It's useful to get a sense for any disparity in performance between franchise and company units, but as a franchisee trying to estimate how much revenue we can expect to produce we are best served by using the franchise restaurant data point in building our revenue projections.
Not all Item 19 earnings claim tables look alike. The example below comes from an old Jiffy Lube FDD / UFOC franchise disclosure document.
Number of Centers: 138
- Range of Gross Sales: $181,032-$417,490
- Median Gross Sales: $350,374
Number of Centers: 138
- Range of Gross Sales: $417,555-$566,127
- Median Gross Sales: $475,283
Number of Centers: 137
- Range of Gross Sales: $567,120-$1,337,743
- Median Gross Sales: $738,931
According to the FDD, for the year covered by the earnings disclosure this franchise had a total of 413 units (service stations), all of which were company owned.
So as a prospective franchisee lacking earnings claims of franchise units to review, your best data point (although not ideal) is the performance of the franchisor's company-owned units.
Given the system's 413 stations are divided into three groups on the basis of median gross sales level, we have a choice of whether to be aggressive with our estimates (choose the highest range) or conservative (choose the lowest range).
Generally speaking, you are safest going the conservative route until you receive strong evidence (such as fresher data from the franchisor or other franchisees) that a more aggressive estimate is appropriate.
Estimating Potential Sales if a Franchisor Doesn't Disclose Earnings Claims in the FDD Item 19
What if the FDD Item 19 doesn't provide some kind of average revenue per unit
figures to help you estimate franchise sales potential?
Predictably, this is where many prospective franchisees throw up their hands and simply give up. Fortunately, you've found this guide, and we're going to show you another way to come up with some reasonable estimates.
To calculate average gross sales per franchise unit when no earnings claim is available in the FDD, follow these steps:
- First, search the franchisor's audited financials (FDD Item 21) to locate the total royalty payments made to the franchisor from franchisees;
- Second, search the FDD to find the percentage of gross sales that the system's franchisees pay out as royalties (the royalty rate);
- Third, search the FDD to find the count of full-time operating franchises in the system (excluding company-owned units from this total);
- Fourth, divide the total royalty payments figure by the number of franchise units in the system (again, excluding company-owned units). You have just calculated the average royalty payment per franchisee unit.
- Finally, divide the average royalty payment per franchisee unit (which you just calculated) by the royalty rate to calculate the average gross sales per franchisee.
Let's take a simple example to show you how the calculations would work:
During last year, make-believe franchise system XYZ had 100 operating franchises and two company-owned stores.
So: we divide $2 million (total royalty payments received from franchisees) by 100 (number of franchisee-owned units) to find that $20,000 is the average royalty payment.
Franchise XYZ's FDD also reveals that the franchise's royalty rate is 5% (that is, franchisees in the system pay 5% of their gross sales to the franchisor in the form of ongoing royalties).
Thus we can divide $20,000 (average total royalty payment) by 5% (20,000 / 0.05) to find that average gross sales per franchise unit equals $400,000.
So with a little bit of detective work and some basic arithmetic, you've just estimated the average sales per franchise unit, even though the franchisor elected not to disclose the figure directly in their FDD!
As a final confirming step, you'll want to investigate the FDDs of several of the franchise's closest competitors to see if projected sales per unit considerably exceed (or fall short of) the estimates for your target franchise.
Estimating Franchise Cash Flow
As we discussed earlier, cash flow is simply the difference between the cash the business takes in and the cash the business spends.
A cash flow analysis can tell us when we might expect to encounter either a cash shortage or a cash surplus. Our purpose in putting together these cash flow numbers is to get a picture of whether working capital (our funds on hand to bridge the period between cash outflows for costs and expenses and cash inflows from customer payments) is sufficient to operate the business.
Let's say we're set up as follows:
- The franchisor shows $2 million in royalty payments from franchisees for last year in its Item 21 financial statements;
- Our initial investment to buy a franchise will be $50,000 (including the franchise fee, start-up equipment, furniture and rent);
- To finance our investment we've gathered $70,000 ($30,000 from savings and $40,000 from a home equity loan;
- After subtracting our initial investment, we have $20,000 remaining to cover operating / working capital.
What we then need to determine is: will a $20,000 cushion be enough to get our business through the startup phase or will there be a cash shortfall, necessitating a scramble to raise additional funds?
Refine Sales Projections
We begin by looking at our projection of annual sales (which we had estimated above using information from the franchise disclosure document Item 19 and Item 21). Let's say projected annual revenue for our chosen franchise is $250,000. To produce a rough projection of potential monthly sales we can simply divide the annual revenue estimate by 12.
However, if by speaking with current franchisees we learn that there is a seasonal skew to revenue (i.e., sales aren't evenly balanced throughout the year), we'll need to work this information into our sales projections. For example, if we're investing in a tax preparation franchise, our period of highest revenue will likely be the first 1/3 of the calendar year (January through April).
So, if there is seasonality to the business, we would build this into our projections by assuming that more than 1/12 of total year sales will fall into certain months (our "high-season" months) and less than 1/12 of total year sales will fall into other months (our "off-season" months).
Adjust for Credit vs. Cash-Based Businesses
After we've built a reasonable estimate of sales for each month of the year, we'll need to consider whether we are investing in a cash-based business or in a business that extends credit to its customers.
Most (but not all) consumer-facing franchises operate on a cash basis, meaning their customers pay immediately for any goods or services received. For example, when is the last time you gave the teenager behind the register at Domino's an IOU that says you'll be back in 30 days to pay for those 2 medium pizzas?
Most (but not all) business-to-business franchises operate on a credit basis, meaning their customers are expected to pay at some point (15, 30, 45, 60 or even more days) after receiving their goods or services.
If our target business is in the practice of extending credit, then we'll need to reflect the typical credit terms in our projections. For example, if our credit terms are net invoice payable in 30 days, sales that occur in January should have receivables noted as being paid in February. If we want to be more conservative (given some customers' tendency to pay late), we might assume that payments on January sales will arrive in March. To develop the most accurate projection we'll want to speak with current franchisees to get a sense for how quickly their customers typically pay.
Project Cash Expenditures
Once we've adjusted our projections to reflect any timing considerations for credit, we need to make a list of expenditures (cash outlays) for a typical month. Such expenditures will include: cost of goods / supplies (these figures should come from the franchisor), rent, loan payments, payroll, advertising, telephone, utilities, insurance, royalties to the franchisor and other miscellaneous payments.
One common practice in financial modeling is to split expenditures into two categories: fixed monthly payments (such as rent, which should be the same each month) and variable payments (such as royalties, which vary depending on the amount of sales generated in a month).
Calculate Available Cash
Now we simply add up the incoming cash and collections to determine our total cash available figure and add up all the monthly expenditures for our total cash paid out figure.
We then subtract total cash paid out from total cash available to calculate our net cash available before distributions to owner and debt service. At this point, if we don't plan to pay ourselves a salary from the franchise over the projection period and if we have no debt payments to service we are done with our cash flow calculations.
Otherwise, from net cash available we subtract any salary we plan to pay to ourselves from the operations of the franchise (such salaries are known as distributions to owner).
Finally, we subtract any debt service amounts (our loan amortization) to calculate our ending cash balance or net cash available after distributions to owner and debt service.
When we've finished with these calculations, it's time to analyze the results:
- If our ending cash balance / net cash available comes up negative several times over the projection period and we can't increase our working capital to plug these holes, we might need to rethink our choice of franchise investment!
- If our ending cash balance / net cash available stays out of negative territory throughout our projection period, assuming we've followed all of the steps outlined above diligently, we are in very good shape and should continue with our investigation of the investment opportunity.
Estimating Potential Profit and Loss
Lastly, we'll put together a projected profit and loss (P&L) statement for a two-year period.
The good news is that most of the numbers we need are already calculated if we have already built our annual sales and monthly cash flow projections. To construct our P&L statement, we take the following approach:
First, we take our anticipated first-year sales and subtract from that our anticipated cost of the goods sold / cost of sales. Cost of goods sold / cost of sales is equal to our beginning inventory plus any inventory purchases we make less our ending inventory. This gives us our gross profit / gross margin number.
Second, we add up all the expenditures for the year from our cash flow statement, which represents our total expenses. Here we have to be careful not to forget to include non-cash expenses such as depreciation and amortization. (For a discussion of these accounting concepts, see FranchiseHelp's guide to advanced franchise accounting.)
Finally, we subtract our total expenses figure from our gross profit number to calculate our first year's profit (net income) or loss before taxes.
To produce our second year's P&L projections, we simply assume a reasonable increase in sales (speaking with current franchisees in the system for a realistic figure) from year 1 to year 2 and a corresponding increase in our cost of goods sold (which you can usually assume will remain a constant percentage of sales).
Some second year expenditures will remain the same (rent, insurance, utilities, and possibly advertising) while others (such as payroll, royalties to the franchisor, and telephone) may increase (again, we can speak with current franchisees to help us form a judgment on these items).
Subtracting expenses from gross profit will give us net income or loss before taxes for the second year. Unless circumstances are unusual, we should be projecting a larger income or profit figure in our second year.
Final Thoughts on Building Franchise Financial Projections

Why go through all these financial modeling exercises?
Though time-consuming, these calculations can reveal whether the investment you're considering makes sound financial sense. In other words, the projections you produce will answer the question with which we began this discussion: "How much money can this franchise make?"
If you're completely unfamiliar with reading financial statements or uncomfortable developing financial projections, that's ok: many prospective franchisees go through the financial modeling exercise with their accountant.
In any case, don't skip this very important piece of your franchise due diligence analysis. If the numbers come out as less than ideal and you choose to go ahead anyway (perhaps because you have fallen in love with the franchise), you may find yourself working longer hours than you ever expected with very little in the way of salary or profit to show for it.
Following the steps above, comparing financial data from several relevant FDDs, and verifying your assumptions through conversations with current and former franchisees, you should be able to produce a very robust, cool-headed projection of how much money you can expect to earn in any particular franchise opportunity.
How Sandler Training is Entrepreneur Magazine's #1 Sales Franchise 9 Years Running
Sandler Training offers a distinctive style of training to companies and individuals in the fields of sales, management consulting and leadership development through on-going seminars and workshops. They provide intensive training, a unique lead generation program, on-going day-to-day support and protected territories to help you succeed in business.
Franchising Meetings & Conventions - More than a Great Party
Planning and staging a dynamic franchise convention that motivates franchise owners requires expert planning, flawless execution and the support of your entire franchise organization. We talked to experts in the industry to get some meeting planning tips that will result in top-notch franchise conventions.